
The following is an extract from the interim report of Tokeya Deep Data Dive GmbH & Co. KG to the project management agency of the BMBF, VDI VDE IT GmbH in Berlin. The specified work packages are included in the project plan as shown in GVB and TVB. GVB (overall project description) and TVB (sub-project description) are available in extracts as PDF under “Downloads”.
Work package 1.1 - Aggregation of different neuropsychological tests to a ToCA test battery
WP 1.1 was implemented as planned, various neuropsychological tests were combined into a ToCA (Tokeya Cognitive Assessment) test battery, with the help of which the test subjects can be divided into the respective patient groups (Alzheimer patients, patients with mild cognitive impairment, healthy persons).
The ToCA test battery so far includes:
- ToCA test (extension of the Montreal Cognitive Assessment = MoCA test, https://www.mocatest.org/)
- Stroop test (Stroop test (exchange of color and word meaning, see Fig. 3))
- Remember images (remind of certain individual images in a sequence of images)
- Handwriting (writing letters and evaluation of typical features)
- Labyrinth (finding your way out of a labyrinth or into one)
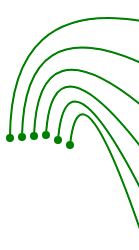
- Spiral (leading a line within a spiral without hitting it) - relevant for Parkinson
In addition, components of the basic concept of the MFC (Mental Fitness Coach) were designed, which will be implemented in the QI of 2020.
For the ToCA test battery, 4 images for selected tasks are shown below:
- Fig. 1: Draw clock, evaluation is automatic, numbers, small/large hands correct
- Fig. 2: Draw cube – The geometric shape is determined automatically, red=false
- Fig. 3: Stroop test – In addition to verbal and visual consistency, time is also measured
- Fig. 4: Labyrinth – A correct passing through the labyrinth is without “red” indicated errors
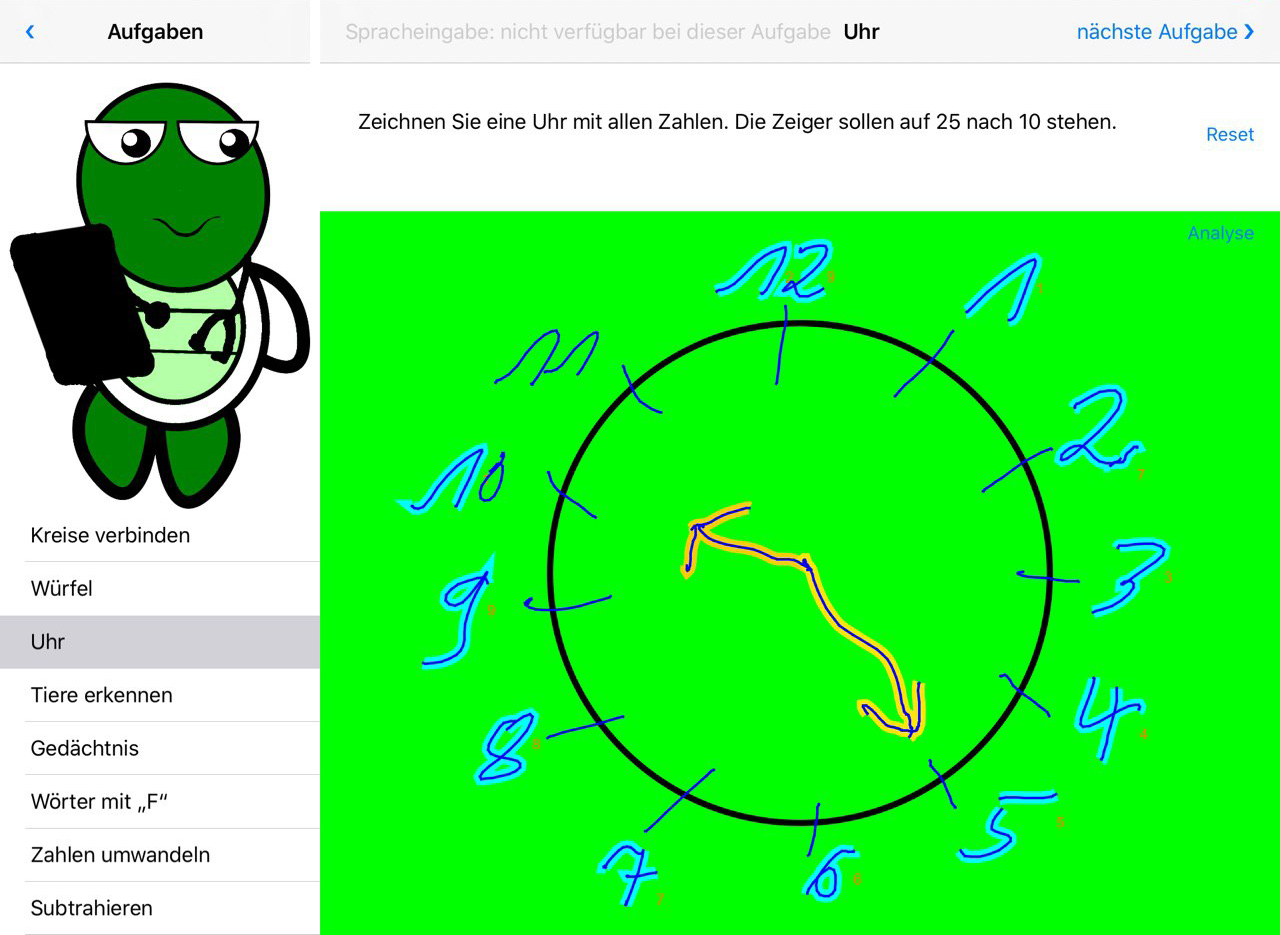
Fig. 1: Clock – the clock has been recognized correctly. The display is in green colour.
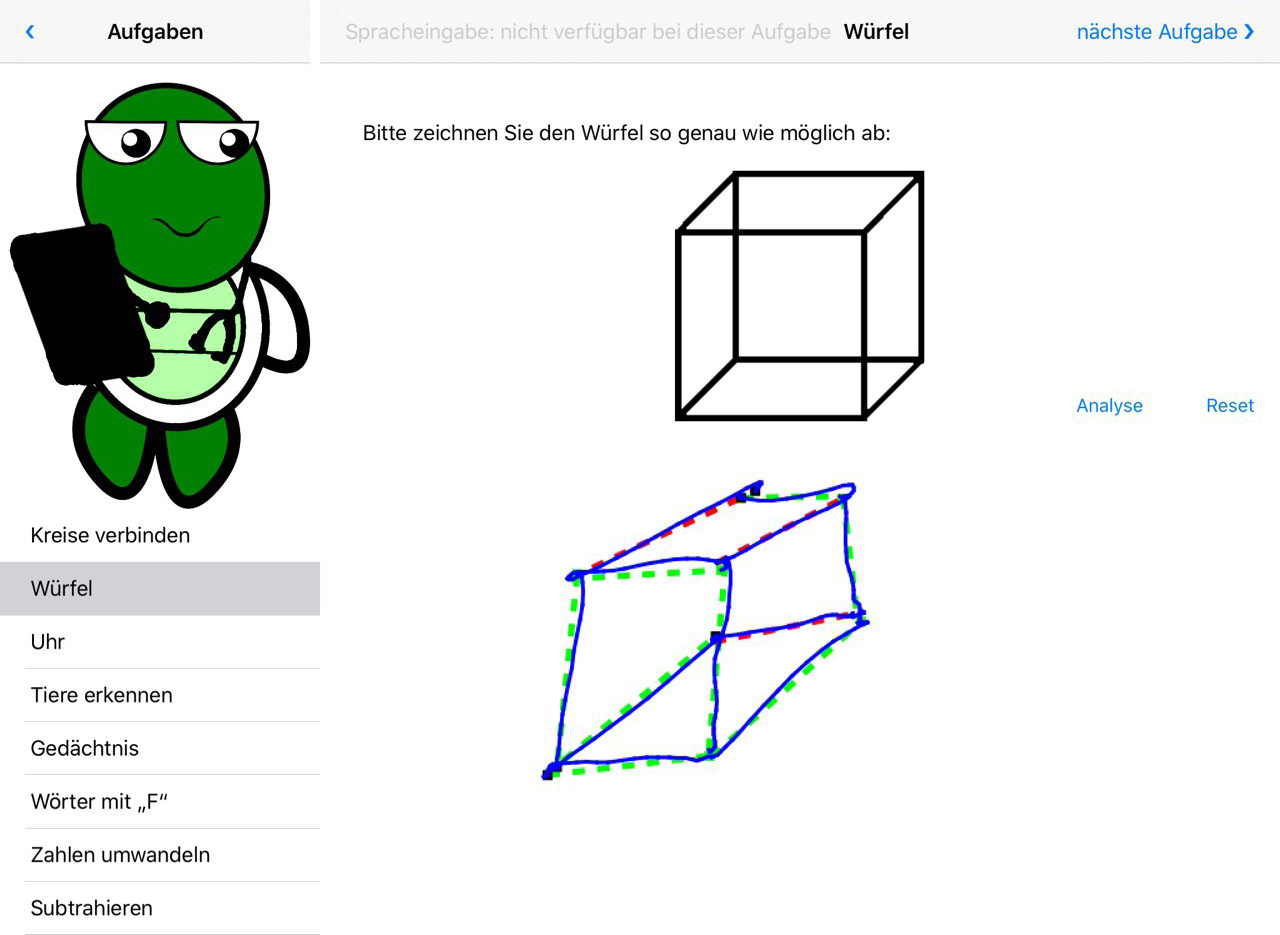
Fig. 2: Cube, partially correct – the cube was hit by the perspective, but the vertices and edges were partially not

Fig. 3: Stroop test with detected error – the colour seen is cognitively separated from the meaning of the word
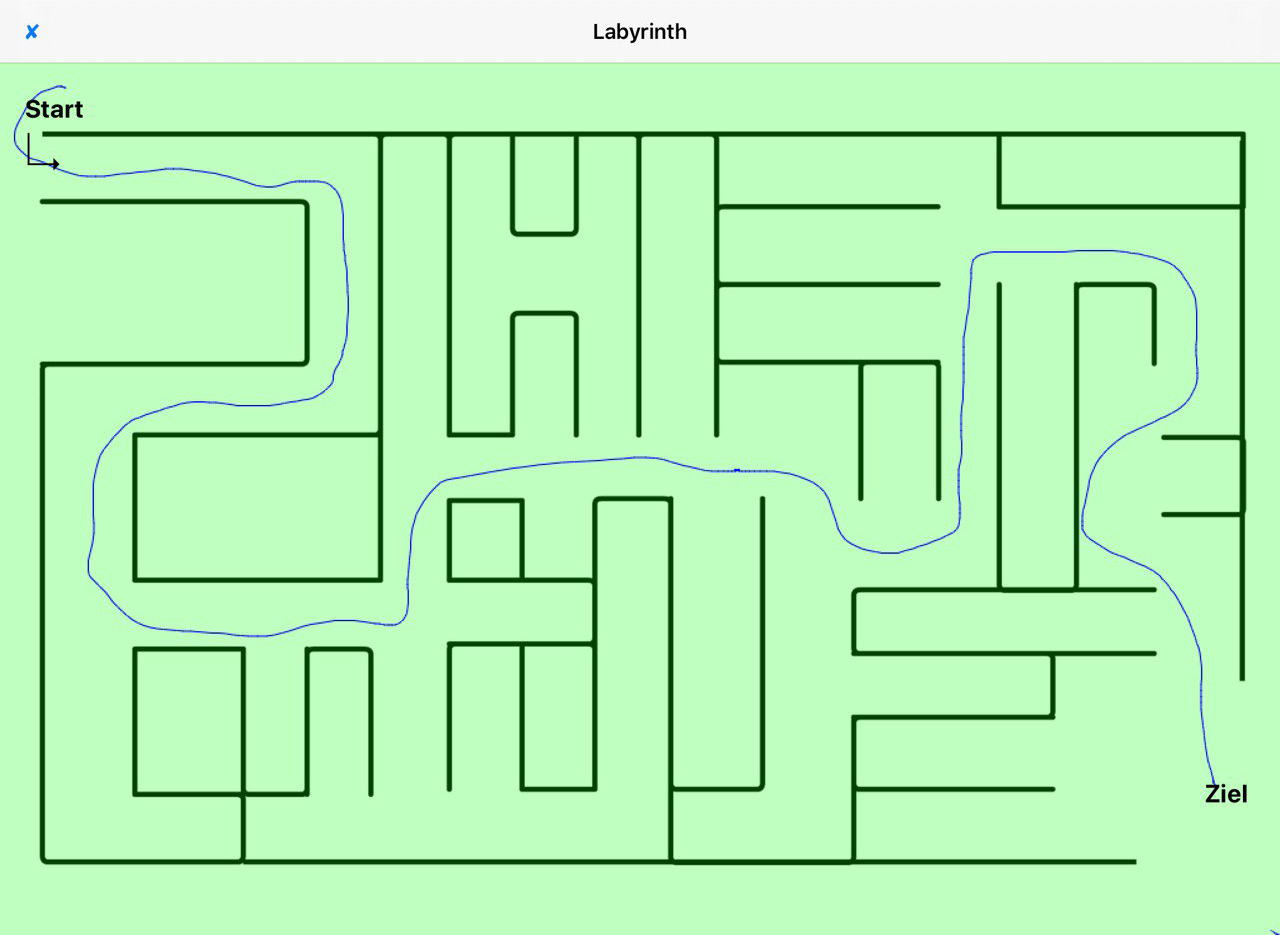
Fig. 4: Labyrinth – the route to the destination was determined correctly, displayed in green colour.
Work package 1.2 - Implementation of the HCI (Human Computer Interface), the personal context survey and the olfactory test
First of all, the questionnaires for the ethics proposal had to be completed in this WP, on the basis of which the personal data can be collected. With regard to the smell test, intensive research into the current state of knowledge was necessary. According to Devanand et al. (2019), a large longitudinal study showed that if the B-SIT odour test of the University of Pennsylvania is successfully completed, the probability of developing Alzheimer’s disease within the next 4 years is 3.4 %. (Brief Smell Identification Test from University of Pennsylvania, see UPSIT https://en.wikipedia.org/wiki/University_of_Pennsylvania_Smell_Identification_Test)
The corresponding smell test (B-SIT, as described in the article) from Sensonics Inc. (www.sensonics.com), which is initially carried out manually, is to be tested in the first study sessions. Alternatively, a test from the company Burghart Messtechnik GmbH from Germany (www.burghart-mt.de) can be used. At present it is not yet clear whether the test can be implemented in the required manner due to the COVID-19 crisis situation.
Note: Currently the development of an app has been started, which should enable the essential tests (see above), interviews and surveys due to the COVID-19 crisis remotely via tele-session. This also includes the smell test, if this is carried out on site by authorized personnel with the patients.
Work package 2.2 - Initiation and implementation of the test procedure by the ethics committee
Tokeya participated in this work package to assist FAU in the comprehensive work on the ethics proposal. Due to the COVID-19 crisis situation, the application will be split into several parts, so that interviews for the preliminary study can already take place after approval. The submission to the Ethics Committee of the Friedrich-Alexander-University Erlangen-Nuremberg will be made over the year 2020. In addition, a data protection concept has been drafted parallel to the ethics proposal, which will already be attached to the ethics proposal part I (submission May 2020).
Work package 2.3 - Creation of documents for test person information
The documents for the proband information were created and attached to the ethics application Part I. The documents for the preliminary study are:
- Participation information
- Declaration of consent
- Data protection declaration of consent with references to data protection
Work package 3.1 - Exploratory selection of the most appropriate AI model approach
In the course of previous work it has become clear that a close integration of AI-based prediction methods for multivariate EEG time series of different groups (Alzheimer's patients (AD) of different severity, MCI (Mild Cognitive Impairment) and HC (Healthy Controls)) with the determination of the nonlinear quantities entropy and fractal dimension mentioned in point 4.3. is necessary. Using the available test data, it was possible to examine the two variables mentioned in more detail. Based on the results in the literature, improvements have already been implemented in the form of Multi-Scale Entropy (MSE), which has proven to be extremely productive in a large number of applications, see Costa (2002, 2005).
The aim of this work package is the development of a multimodal procedure, which, based on the analysis of different significant parameters of the EEG time series in combination with the nonlinear quantities HFD (Higuchi Fractal Dimension, already sufficiently characterized in TVB and GVB, see Downloads) and MSE, will be able to distinguish individuals as well as possible from the corresponding groups. We have succeeded in doing this in a first step, see Figures 5-8 below. The obvious differences between the MSE and HFD values of individual AD subjects compared to those of the groups must be combined in a formal AI procedure (e.g. an adaptive, multidimensional decision tree) in the reporting year 2020, possibly extended by additional parameters that deepen the discrimination, and e.g. those scales that are particularly significant for the differentiation must be determined adaptively in the current situation, see also Park (2007).
A significantly larger number of partly self-determined EEG data of AD patients is indispensable for this purpose, in addition to the existing small data pool. Since this is currently not possible due to the ongoing restrictions in nursing homes caused by COVID-19, we have to improvise until our own EEG examinations are possible in 2021 and then rely on the data of other research groups in Europe in order to develop the new algorithms at least in the first steps according to the planning in the TVB. Only the responsible persons of the research groups are mentioned here: Bruno Dubois in France, Claudio and Fabio Babiloni in Italy, Erol Başar and Bahar Güntekin in Turkey, Nesma Houmani and François Vialatte, also in France, Javier Escudero and Daniel Abasolo in Great Britain, formerly Spain. The procurement of this data by mutual agreement and benefit will mean further considerable expenditure in the current COVID 19 crisis situation.
Explanation of the results on discrimination against MSEs of single individuals from groups:
Quantitative and qualitative changes in the EEG signal can be detected in a variety of neurological diseases such as Alzheimer's or Parkinson's disease. Often an increase or decrease in the complexity of the EEG signal is observed. This change in complexity can be quantified by different measures of entropy, see Park (2007).
To demonstrate this using entropy as a measure of the (non-)predictability of the EEG signal, a data set from 2006 consisting of the EEG measurements of 12 Alzheimer patients (AD) and 11 healthy patients (HC) from Valladolid (Spain) was evaluated (origin of the data, see Smith 2017).
First, the mean values of the MSE for all measurements (see Escudero (2006)) were determined for both the AD group and the HC group for 16 electrodes each in the reporting period. The MSE measures on different time scales the probability that sets of patterns that are similar for a number of data points are still similar one data point further. More (i.e. higher) complexity in the patterns is expressed here in higher MSE values.
With the exception of the highest time scales, the HC group showed higher levels of MSE than the AD group, which can be used to differentiate between Alzheimer's patients and healthy individuals.
Since the MSE can only provide unreliable values for very short signals and it also requires a high computational effort, the complexity in QI/2020 is to be determined with other entropy measures. This will be discussed in more detail in the 2020 reporting period.
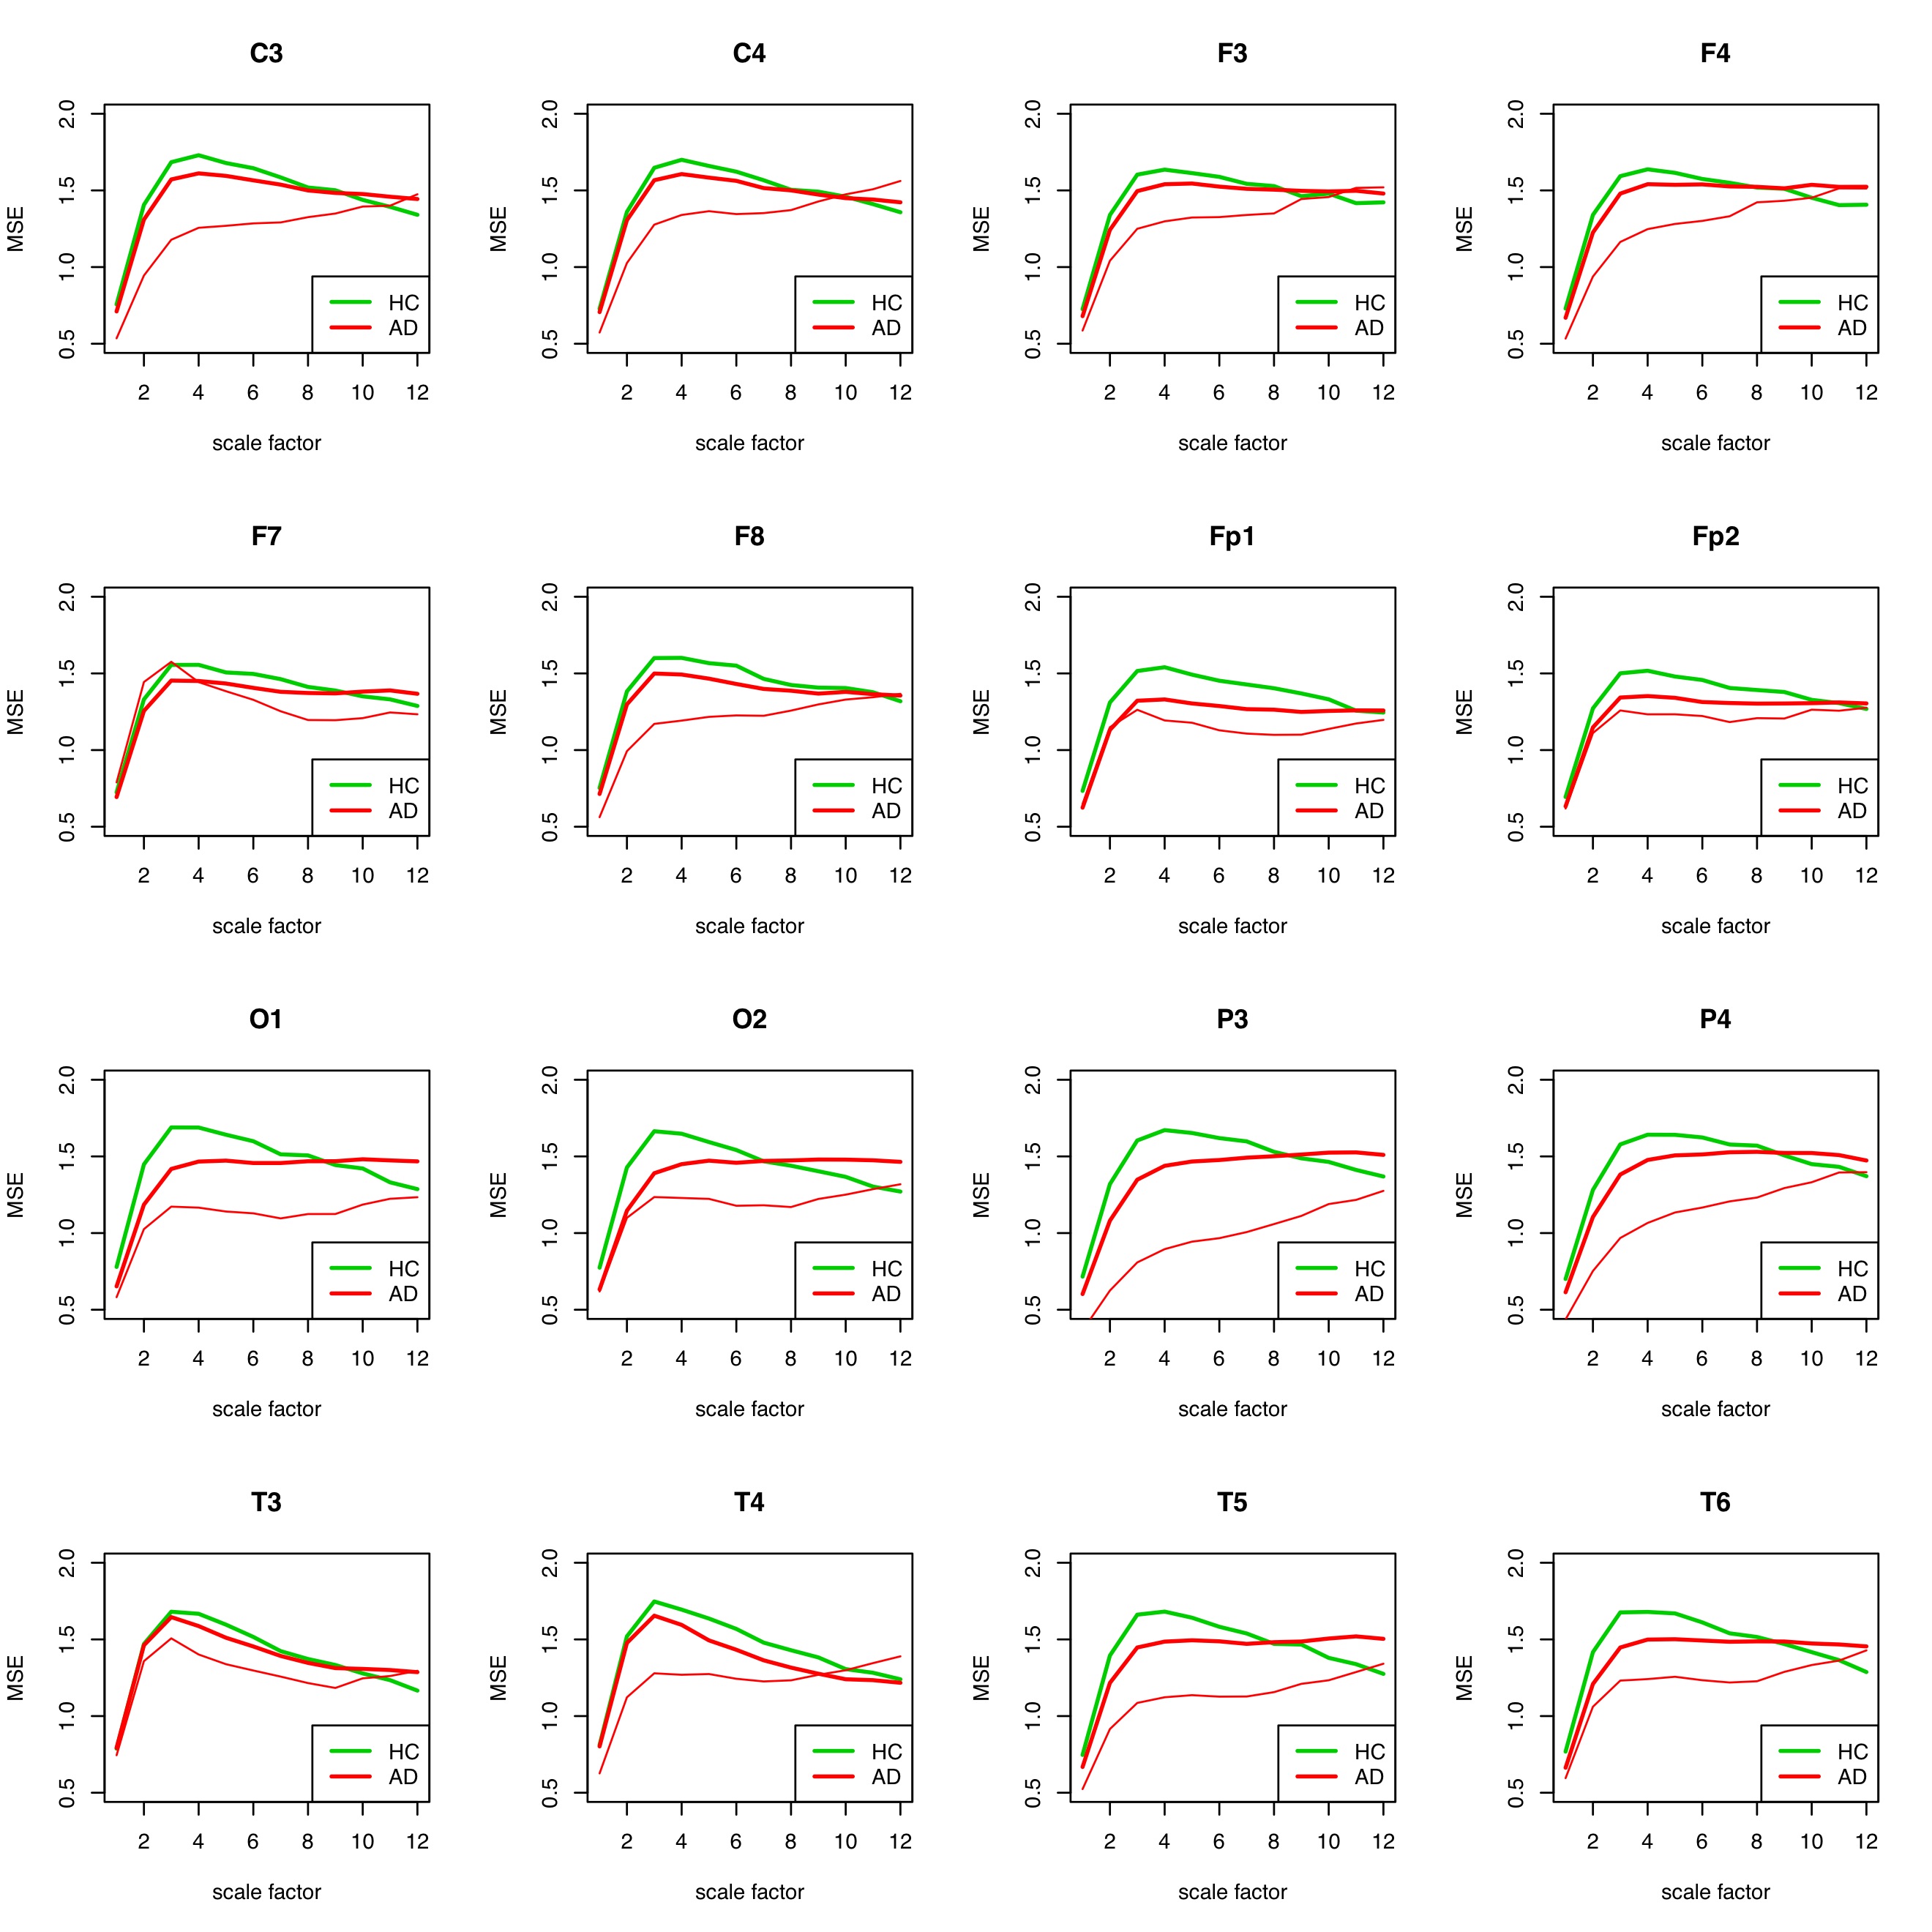
Fig. 5: MSE for each individual electrode for patient 1 (AD) compared to the group of remaining AD patients and healthy individuals. The individual patient curve is plotted in thin red, the group curve in bold red. The AD group contains all other AD patients except #1.
- Escudero J., Abasolo D., Hornero R., Espino P. and López M. (2006). Physiological Measurement, Vol. 27, No. 11. IOP Publishing Ltd. Bristol (UK). https://iopscience.iop.org/article/10.1088/0967-3334/27/11/004
- Smith, K. (2017). Accounting for the Complex Hierarchical Topology of EEG Functional Connectivity in Network Binarisation. University of Edinburgh, referenced by https://arxiv.org/abs/1610.06360. data in https://datashare.is.ed.ac.uk/handle/10283/2783
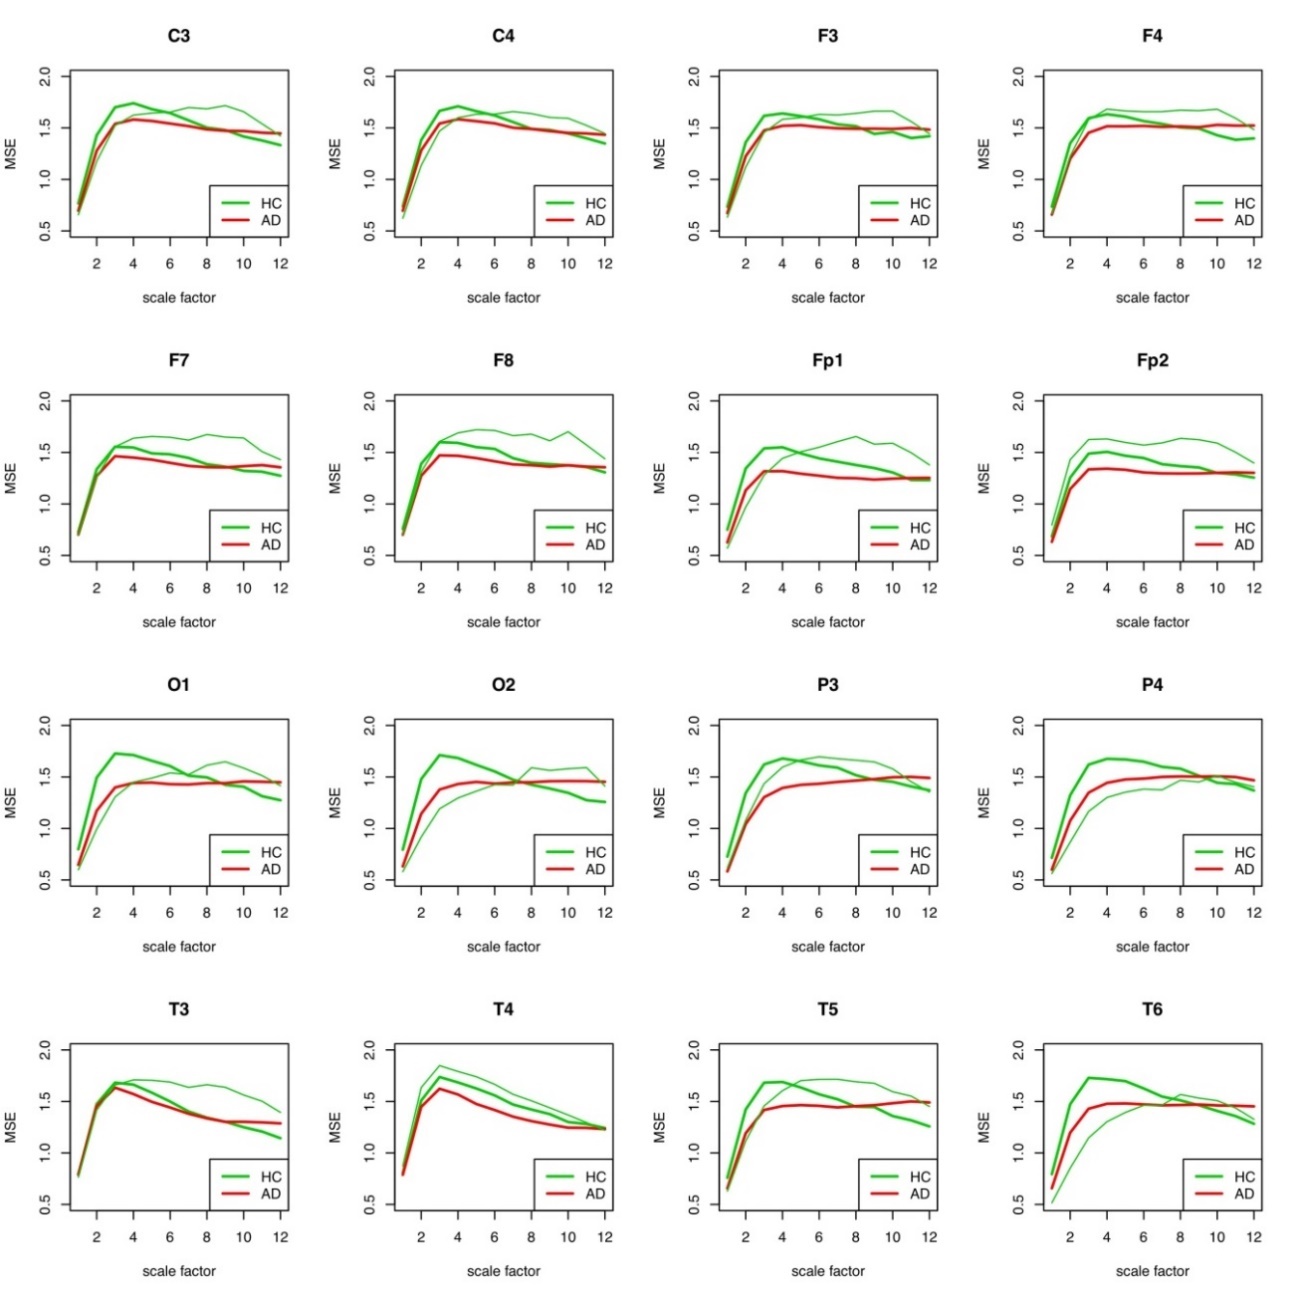
Fig. 6: MSE for each individual electrode for patient 2 (HC) compared to the group of AD patients and the remaining healthy subjects. The healthy individual curve is plotted in thin green, the group curve in bold green. In the HC group are all other HC probands except #2.
It is remarkable that the differentiation of the two groups is only well possible with all electrodes in a scale range of about 4-8. This is largely consistent with the results of Park (2007).
Patient #1 can be easily distinguished from the AD group and the HC group for wide scale ranges for almost all electrodes.
The observation of the curve progressions of all AD patients (12) and all healthy persons (11) shows even with this small number of cases that a selection of the assessable "good" scale ranges must be coupled with a selection of suitable electrodes in order to be able to make a good differential diagnosis. Which electrodes this can be for a large patient ensemble must be determined by an appropriately large number of examinations. As can be seen in the following figures 7 and 8 for the same procedure for HFD, the results at group level can only be well distinguished there for a large j_max.
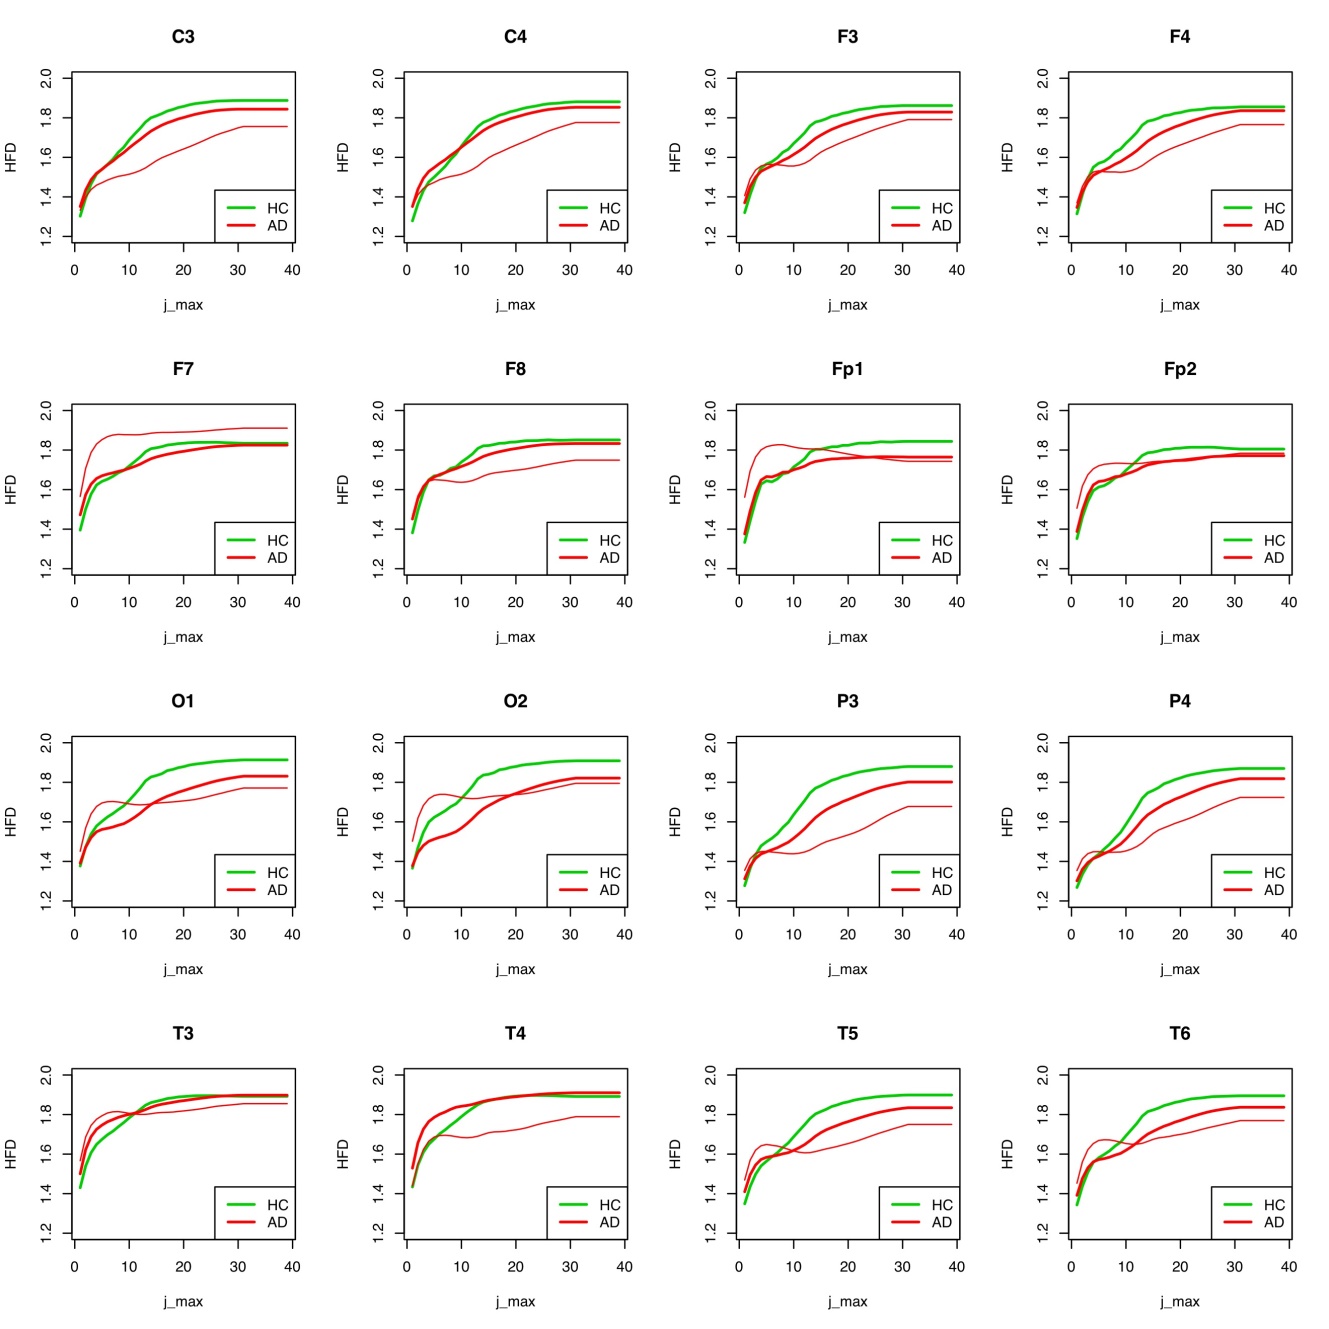
Fig. 7: HFD for each individual electrode for patient 1 (AD) compared to the group of remaining AD patients and healthy individuals.
However, this does not apply to all electrodes. For T3, T4, F7, F8, Fp2, C3, C4, F3 and F4, no differentiations are possible at group level if the “subdivision values of the curve” (j_max) are high. The higher the subdivision value j_max is, the more partial sections of the whole curve (an EEG curve of a certain time length) are used to determine its complexity. As in the case of MSE, the values of the HFD for all measured partial segments are determined per electrode and then averaged, on the one hand per patient and on the other hand for the whole group.
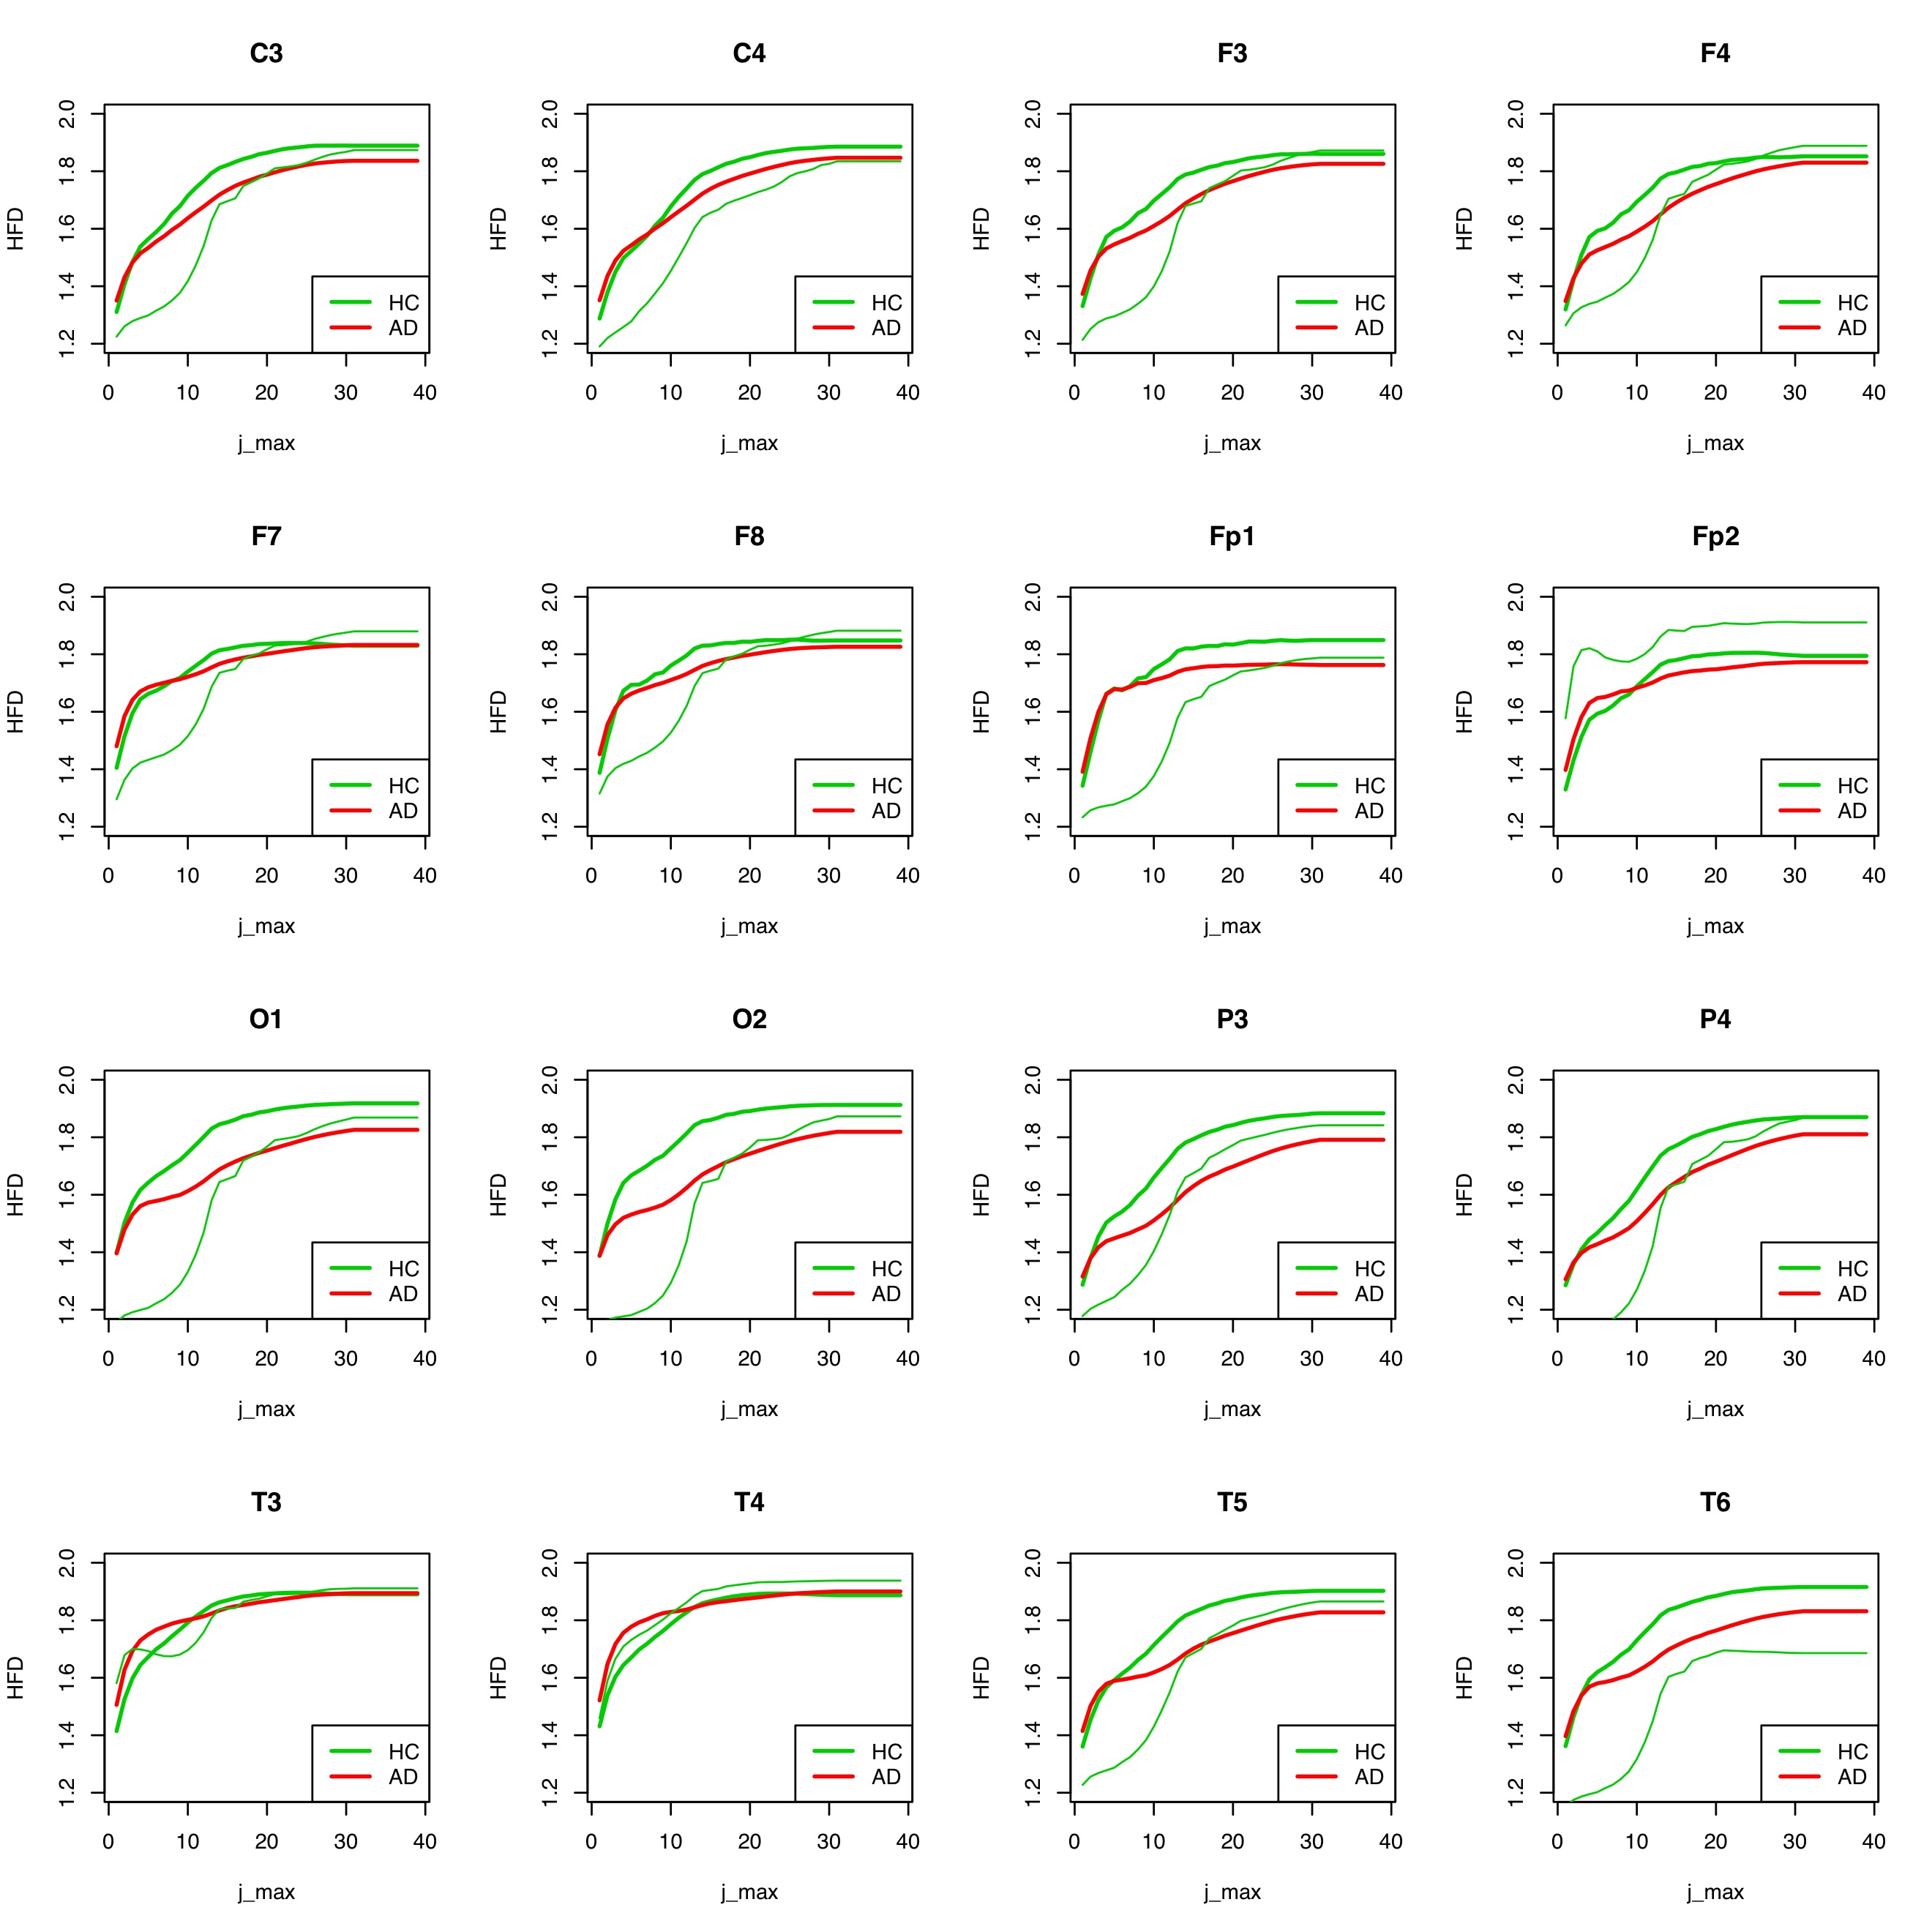
In Figure 8, the result for the group distinguishability of AD and HC seems to be somewhat worse for individual electrodes than in Figure 7, especially for high values of j_max, for which the results should actually be significant. In any case, considerably more measurements of individual cases are needed to make a valid statement whether HFD is a useful instrument for differentiating between AD and HC groups, or for a classification decision whether an unknown EEG signal is more likely to be assigned to the AD or HC group.
It is currently not yet clear whether linking MSE and HFD offers an advantage in terms of improving group differentiation or individual case classification.
In order to clarify these questions sufficiently, a quantitative investigation of the selectivity of the groups AD and HC on the basis of MSE and HFD will be carried out in the reporting period 2020, as already mentioned to some extent in Park (2007), using classification methods from the AI.
References:
- Costa M., Goldberger A., Peng C.-K. (2002). Multiscale Entropy Analysis of Complex Physiologic Time Series. Physical Review Letters, Vol. 89, No. 6. DOI: 10.1103/PhysRevLett.89.068102
- Costa M., Goldberger A., Peng C.-K. (2005). Multiscale entropy analysis of biological signals. Physical Review E 71, 021906. DOI: 10.1103/PhysRevE.71.021906
- Park J.- H., Kim S., Kim C.- H., Cichocki A., Kim K. (2007). Multiscale Entropy Of EEG From Patients Under Different Pathological Conditions. Fractals, No. 15, Vol. 4, p. 399-404. World Scientific Publishing Company. https://doi.org/10.1142/S0218348X07003691
Work packages 4.1 - Automatic artifact removal by pattern recognition in EEG time series;
4.2 - Use of linear and non-linear methods in combination for time series analysis;
4.3 - Determination of fractal dimension/entropy in various forms
The implementation of work packages 4.1 - 4.3 has been successfully started. Fortunately, data on Alzheimer's dementia from research groups in Spain and Italy were obtained, transferred and evaluated with regard to pattern recognition. The Spanish data from Valladolid were already referenced in WP 3.1, see Smith (2017). The Italian raw data of 11 AD patients were obtained by the research group of Claudio Babiloni, see Noce (2019). Due to the COVID-19 crisis, which had a devastating effect especially in Italy, it has not yet been possible to establish closer contacts with the working groups in Rome and Naples. (…)
The artefact detection in the data from the SDN (Istituto di Ricerca Diagnostica e Nucleare, see https://www.sdn-napoli.it/istituto/) already works well. As it turned out, however, finding “quiet” periods in the EEG and “cleaning” them - here, own methods were developed (see Fig. 9-12) - turned out to be more problematic than expected. The determination of epochs or segments in the EEG time series, which form the basis for the evaluation of the time series according to the specified parameters, was still carried out in a semi-automatic form and is now to be automated in the reporting year 2020. The main problem is that the parameters mentioned can only be determined correctly (stationarity condition, see https://en.wikipedia.org/wiki/Stationary_process) if the test person is actually in a quiet state, i.e. does not think of anything essential, so that no changes in the signal occur, such as trend increases, which could then possibly be misinterpreted as parts of e.g. incorrectly recognized muscle artifacts.
During the EEG examination it should be guaranteed that the brain of the test person is in the so-called default mode (a kind of autopilot of the brain, see https://en.wikipedia.org/wiki/Default_mode_network), because deviations of the EEG in this as defined “actual” resting state provide indications of pathological states like AD, which have also been determined with other examination methods like fMRI or MEG. The default mode acts here as a kind of reference status.
In our previous work, we found that entropy is the most productive variable for differentiating people with Alzheimer's dementia from healthy individuals at the group level. The aim of its determination is the individual prognosis of the course of the disease, as already described in 3.1. as a first step. In addition, the synchronicity disturbance that occurs in Alzheimer's dementia must also be determined on an individual level on a significant scale. This is to be done, among other things, by means of graph-theoretical analyses of the resting-state network (rsn), in particular of the default-mode network (DMN) and so-called EEG microstates (see Smailovic et al (2019)) contained therein, and here also of the loss of phase synchronicity at selected points of the DMN. These are the results of the literature searches in the reporting period 2019, which will be investigated in the new year on the basis of the given data pool.
In the following figures 9-12 the results of the semi-automatic determination of the “quiet segments” relevant for EEG analysis within defined measurement epochs, e.g. as shown here with 620 seconds, the patient's EEG measurement time SDN_011 (SDN - meaning see above). Here only the results for channel 1 = Fp1 (frontal left) are given. Thus, artifact detection is only important in so far as quiet EEG segments are required for the EEG analysis, since this is only meaningful at all if almost stationary conditions for the EEG signal (no variable mean value, no trend) are observed.
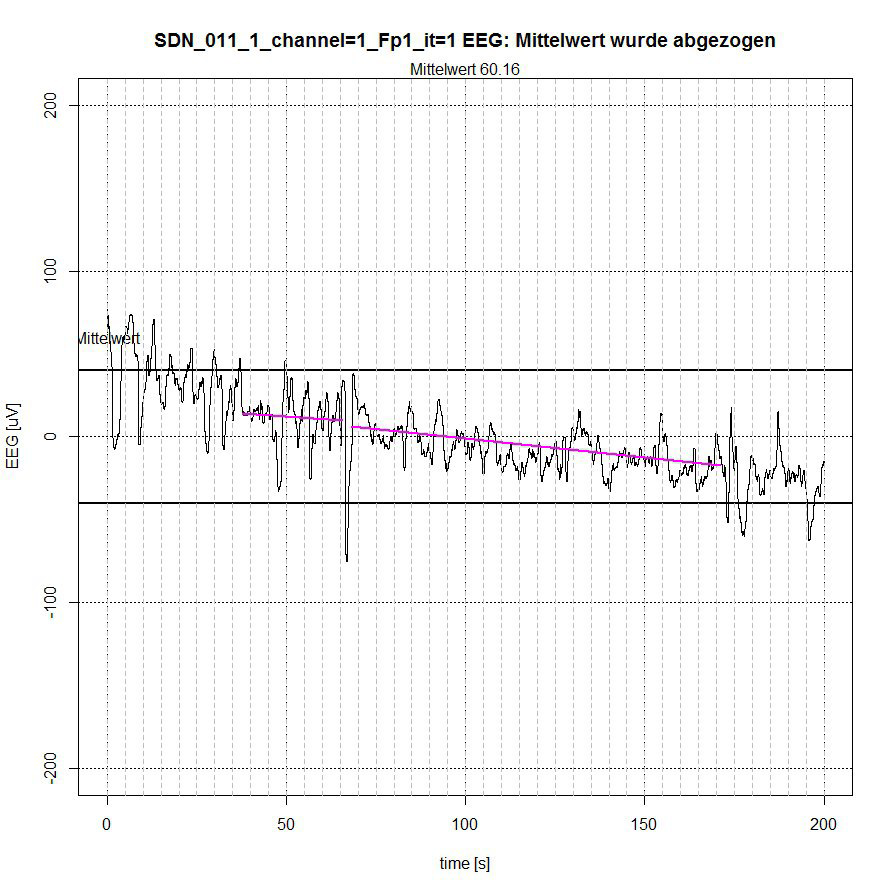
Fig. 9: Time segment I (seconds 0-200) of SDN 11 for channel Fp1, 2 quiet segments found.
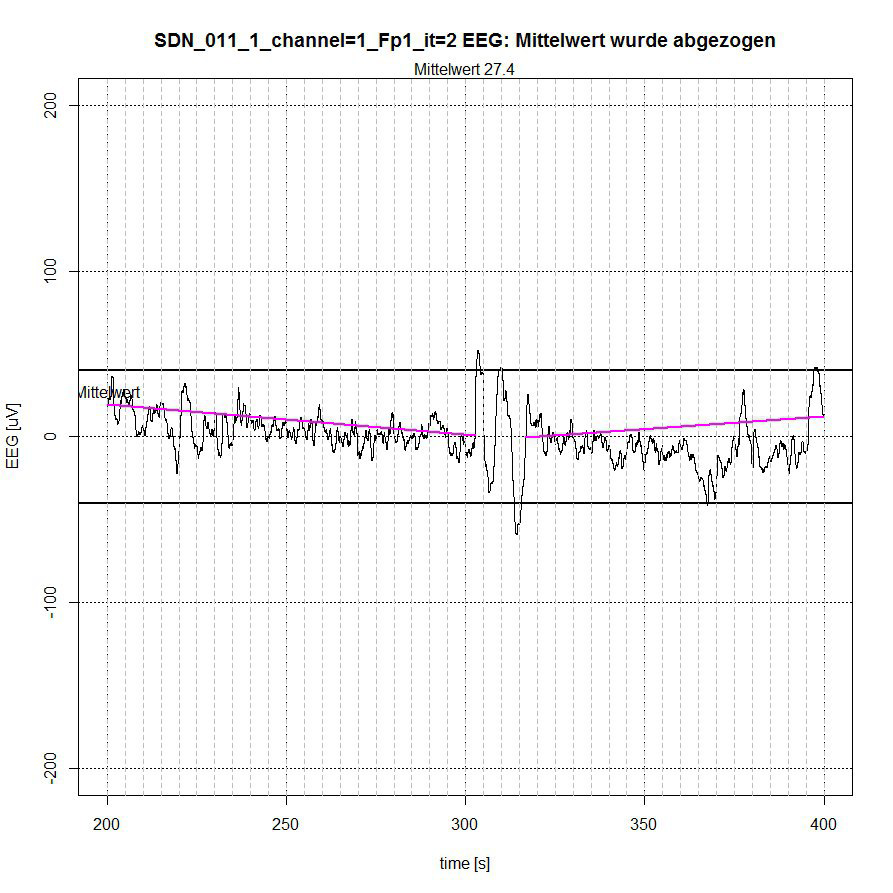
Fig. 10: Time period II (seconds 200-400) of SDN 11 for channel Fp1, 2 quiet segments found.
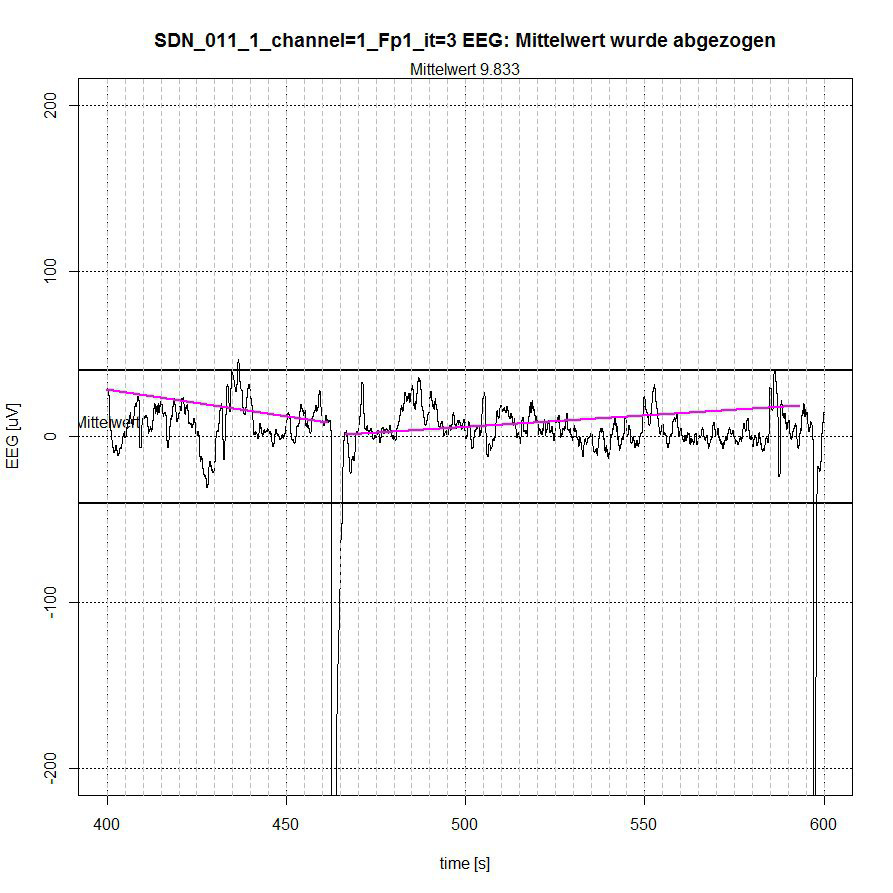
Fig. 11: Time segment III (second 400-600) of SDN 11 for channel Fp1, 2 quiet segments found.
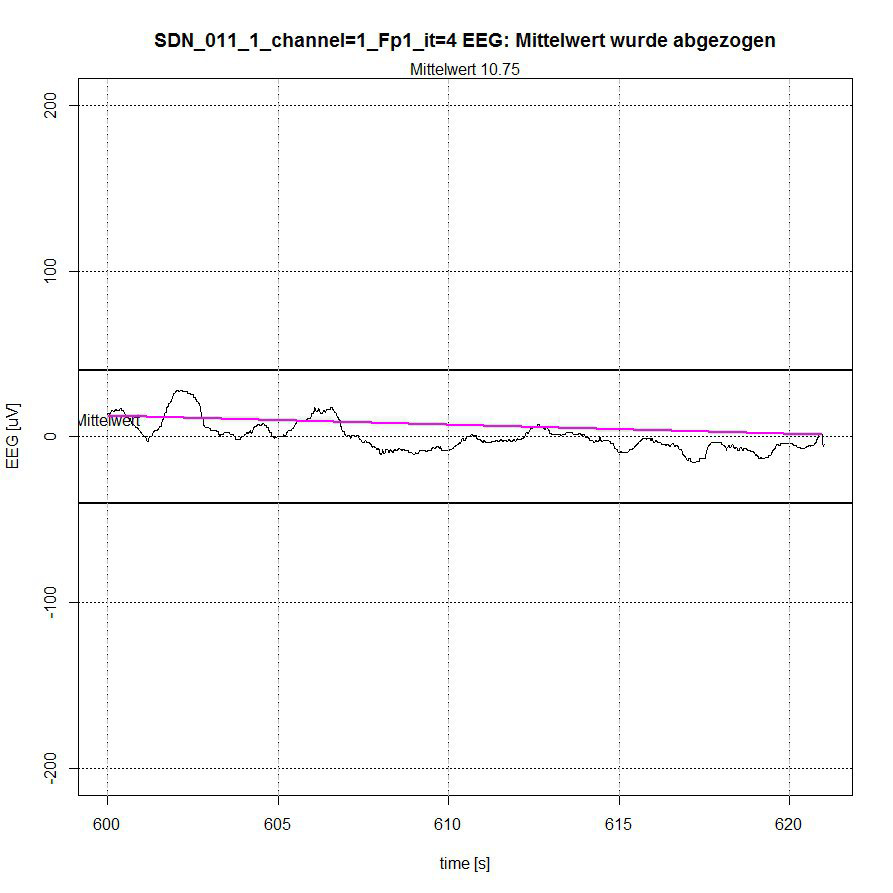
Fig. 12: Time segment IV (second 600-620) of SDN 11 for channel Fp1, 1 quiet segment found.
Description of figures 9-12:
The entire EEG signal was divided into 4 time sections. The signal is limited by a -50 µV interval, indicated by two bold lines above and below the zero line. In each time section the average value of the applied signal is subtracted for normalization reasons, so that a reference to the zero line is maintained. The algorithm determines those segments that are completely within the -50-µV interval and thereby excludes segments that are recognizably repetitive as a related sequence of EEG values outside the limiting interval, see Fig. 9 (second 0-37 and second 172-200) and Fig. 10 (second 303-316) or whose peak value (these are spikes, i.e. short peaks) is far outside the -50 µV acceptance interval, see Fig. 9 (peak at second 67) and Fig. 11 (peaks at second 464 and second 596).
The algorithm includes borderline cases of EEG values in the acceptance of segments when their (single) peak values are only for a short time and only with some µV outside the acceptance interval, as shown in fig. 9 for second 50, in fig. 10 for second 397 and in fig. 11 for second 437. The lines in magenta color then indicate the connection from the starting point of the determined accepted segment to the end point of the determined accepted segment. However, they do not yet represent a trend that can be determined in the first instance by a linear trend analysis for this segment to check the stationarity condition.
A central question that will arise in the reporting period 2020 is the question of the significant segmentation of EEG signals, i.e. segmentation according to the detection not only of muscular or ocular artefacts, but also of EEG events that are due to the incomplete decoupling of EEG measurement from the thought process. Therefore, when obtaining significant EEG segments at rest, we will focus on the fact that the subjects are in the DM (default mode) state of the brain to ensure that no targeted thinking takes place during EEG recording. An aid for this can also be the analysis of the EEG signal with the MSE (see WP 3.1), because it can be assumed that the EEG signal in the DM is characterized by lower gamma components, which possibly results in a lower entropy. This remains to be investigated in the new reporting period for the year 2020.
References:
- Noce G. (2019). Raw data-Abnormalities of Resting State Cortical EEG Rhythms in Subjects with Mild Cognitive Impairment Due to Alzheimer's and Lewy Body Diseases. Mendeley Data, v2. http://dx.doi.org/10.17632/ncxcw6g324.2. Mendeley Data at https://data.mendeley.com/datasets/ncxcw6g324/2
- Babiloni C., Del Percio C., Lizio R., Noce G., … Bonanni L. (2018). Abnormalities of Resting State Cortical EEG Rhythms in Subjects with Mild Cognitive Impairment Due to Alzheimer’s and Lewy Body Diseases. Journal of Alzheimer's Disease, vol. 62, no. 1, pp. 247-268, 2018. DOI: 10.3233/JAD-170703. see https://content.iospress.com/articles/journal-of-alzheimers-disease/jad170703
- Smailovic U., Koenig Th., Laukka E., Kalpouzos G., Andersson Th., Winblad B., Jelic V. (2019). EEG time signature in Alzheimer´s disease. Functional brain networks falling apart. NeuroImage: Clinical 24 (2019) 102046. https://www.sciencedirect.com/science/article/pii/S2213158219303936
 English
  Deutsch